Recently, while demoing Message Aid to a colleague the demo god's blessed me with a teachable moment. While on the demo, what should have been an easy operation was failing. At the time I was completely unable to see why the application was failing. After the call, I quickly SSH'd into the server to inspect things. After a wee bit of journald and grep I was able to see exactly why it was failing. Thank you to solid logging.
That next week, I set out to implement centralized logging so that if this happened in the future I wouldn't be caught in a lurch. While implementing centralized logging and making it visible on a Grafana instance, I ran across an unexpected benefit of the vertical slice architecture.
The Idea
In a variety of languages and frameworks its common to see the log message annotated with the class name. In the case of Java or dotnet, I've grown accustom to my log messages always containing the fully qualified name of the class in the log message:
[10:00:02 MessageAid.SomeNamespace.Class INFO] Look! A log message
or in JSON (Serilog)
{
  "@l":"INFO",
  "@t":"2022-10-11T14:34:46.4198800Z",
  "@m":"Look! A log message",
  "@i":"1d4cc25c",
  "SourceContext": "MessageAid.SomeNamespace.Class"
}
While playing around in Grafana I had the obvious idea that I could monitor the health of my feature by tracking the log messages for the namespace that contained the vertical slice. For this example the feature is a message locker, which stores your messages in your own cloud account. All of the functionality is stored in a single directory/namespace, which allows me to scope the log messages I care about to a single namespace.
{app="ma", source_context=~"MessageAid.MessageLocker.+"}
loki query
However, that doesn't help me see the success or failure of the feature, for that I'm going to group it by the log level.
sum by (level) (
  count_over_time(
    {app="ma", source_context=~"MessageAid.MessageLocker.+"}[$__interval]
  )
)
loki query
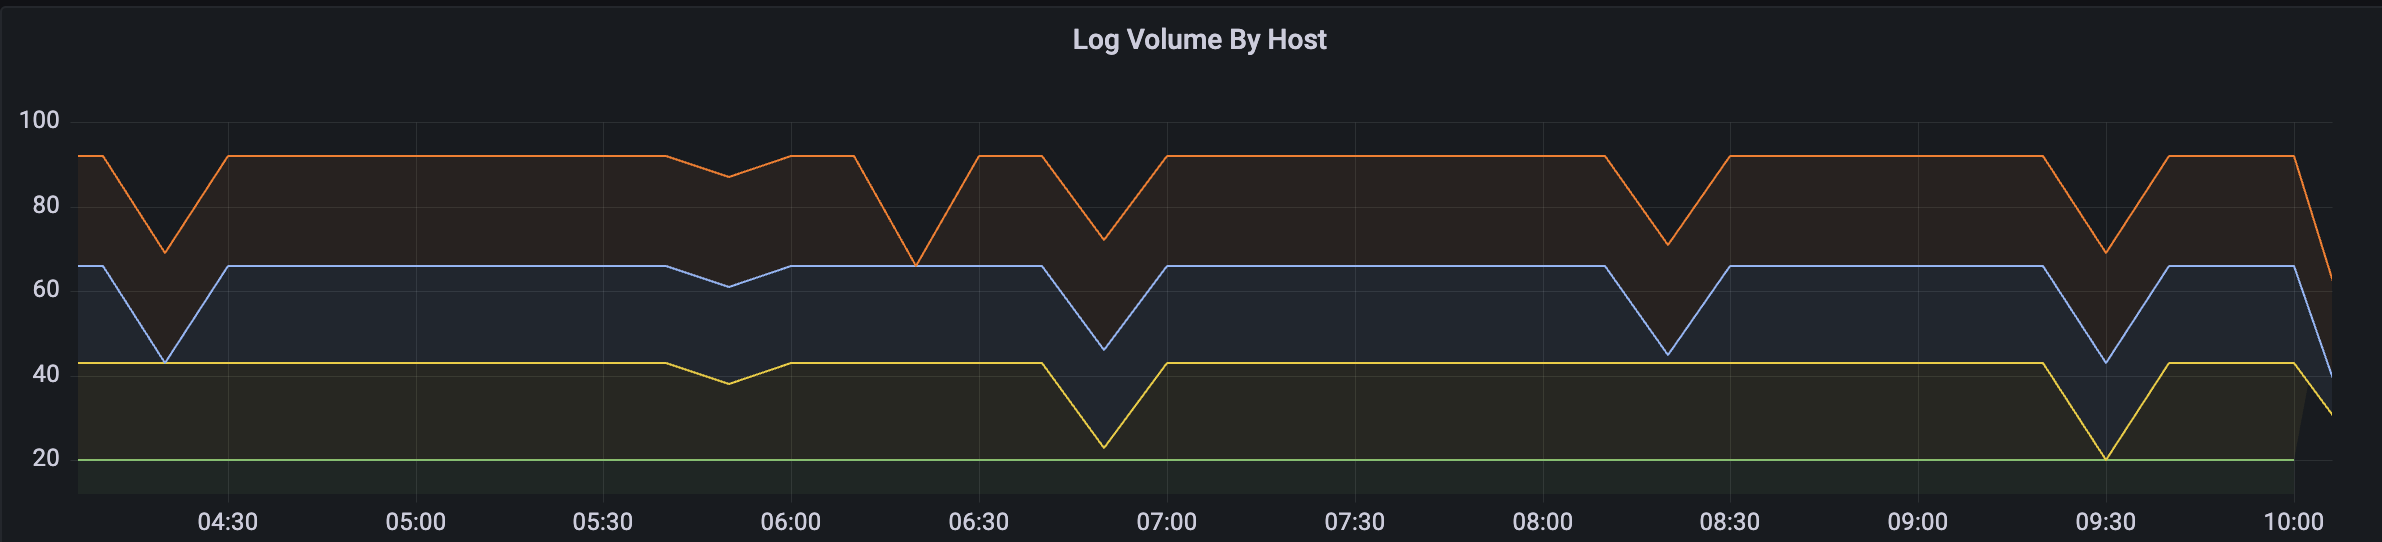
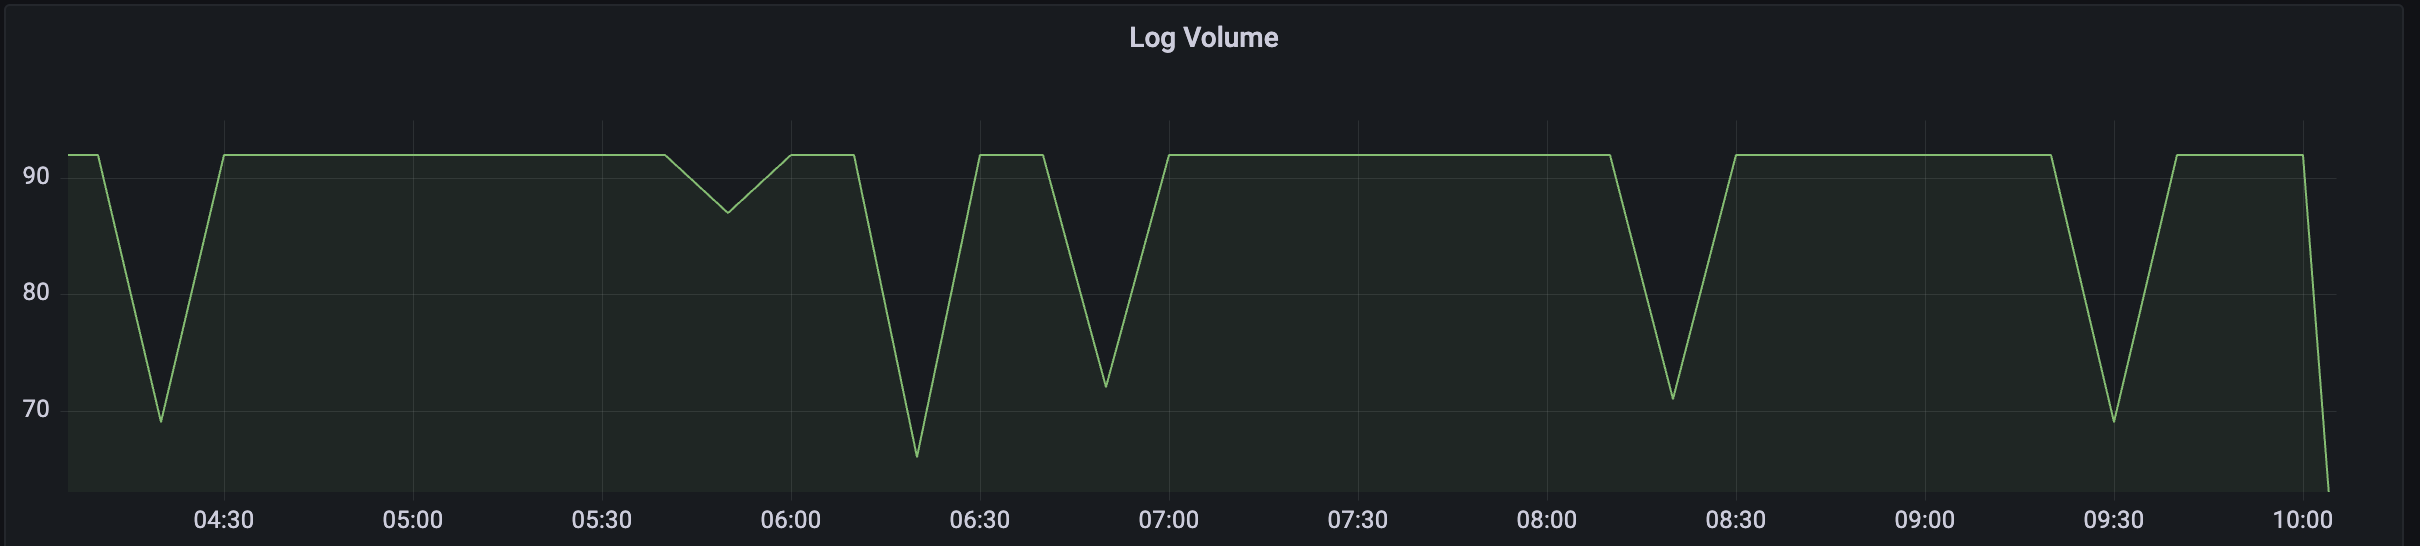
Currently, there where only info messages, so this graphic is showing log volume by host (which in the future would be the log level)
With this query, I can now see the overall volume of logs, which gives me a sense of activity in the system. Even a spike in "good" messages is an interesting signal that I can keep my eye on. Being able to group them by level gives me a nice, log data only, overview of the system. If I see an increase in warning or error, I can zoom into those logs quickly to diagnose the issue.
In closing
Like most operations people, I like being able to see what my system is doing. I've previously been limited in what logging tools I could deploy and use based on either cost or scale. Right now Message Aid is still very small, so implementing a log aggregation system at this point was easy and pleasant.